> For the complete documentation index, see [llms.txt](https://f1rstbyt3.gitbook.io/hacking-notes/llms.txt). Markdown versions of documentation pages are available by appending `.md` to page URLs; this page is available as [Markdown](https://f1rstbyt3.gitbook.io/hacking-notes/dfir/memory-analysis/windows.md).
# Windows
## Types of memory:
### Private Memory
Sole domain of the process and not mapped outside of the process. Typically allocated with API function `VirtualAlloc` and includes application data, `process` `heap` and `stack`.
**Shouldn't** expect to see `EXEs` or `DLLs` in private memory. Most memory pages are however, initiated with `READWRITE` privileges as they reading and writing to the `process stack`, `heap` and `data files`. 0.24% contains legitimate `READWRITE_EXECUTE` permissions and 17.5% contains legitimate `EXECUTED_READ`. Should **not have executable code in private memory!**
### Shareable Memory
known as 'mapped' memory; designated for mapping all or part of shared files for use by the process. Can be shared with other processes, but not required. `.dat` and `.mui` files are normally found here and mapped/loaded from files on disk. 0.14% contains legitimate `READWRITE_EXECUTE` permissions and 0.036% contains legitimate `EXECUTED_READ`
### Image Mapped Memory
part of shareable memory, but tagged differently. Files on disk are also mapped here, intended for legitimately loaded `EXEs, DLLs & Drivers`. are of process memory where execute permissions regularly occur. 0.1% contains legitimate `READWRITE_EXECUTE` permissions and 0.62% contains legitimate `EXECUTED_READ`
M**ajority of mapping use** `EXECUTE_WRITECOPY` (copy on write is a protective mechanism for shared code) and `EXECUTE_READ` privileges.
### Process memory
[#process-environment-block-peb](#process-environment-block-peb "mention") located here.
### Kernel memory
houses process #memo `memory pools`, the [#virtual-address-descriptor-vad-tree](#virtual-address-descriptor-vad-tree "mention") and `page tables`
***
## Process Environment Block (PEB)
The PEB is a data structure in the Windows operating system that contains information about a specific process. It is used by the operating system and the process itself to manage various aspects of the process’s execution.
#### Key Components of the PEB
1. **Process Parameters**: Contains information about the command line arguments, environment variables, and the current working directory.
2. [**Image Base Address**](/hacking-notes/dfir/memory-analysis.md#image-mapped-memory): The base address where the executable image of the process is loaded in memory.
3. **Heap Information**: Details about the process heaps, including the addresses and sizes.
4. **Loaded Modules List**: A list of all the DLLs and modules loaded into the process's address space.
5. **Thread Information**: Data about the threads running within the process.
6. **Exception Handling**: Information about exception handling and the process's exception handler lists.
7. **Critical Section Information**: Details about the critical sections within the process.
### PEB Contains three useful lists:
* **InLoadOrderModule List**\
The `InLoadOrderModuleList` is a doubly linked list within the PEB that maintains the order in which modules (DLLs and executables) were loaded into the process's address space. This list helps the operating system and debuggers track the sequence of module loading.
* **InInitializationOderModule List**\
The `InInitializationOrderModuleList` is a doubly linked list within the PEB that maintains the order in which modules have their initialization routines (e.g., `DllMain`) called. This list ensures that the initialization functions are called in the correct order, respecting dependencies among modules.
* **InMemoryOrderModule List** \
The `InMemoryOrderModuleList` is a doubly linked list within the PEB that tracks the order in which modules are loaded into memory. Unlike the `InLoadOrderModuleList`, which focuses on the load sequence, this list is concerned with the memory layout and the order of memory allocation for the modules.
#### Key Fields in each:
* **BaseDllName**: The name of the module.
* **DllBase**: The base address where the module is loaded.
* **EntryPoint**: The entry point of the module.
* **SizeOfImage**: The size of the module in memory.
* **FullDllName**: The full path to the module.
***
## Virtual Address Descriptor (VAD) Tree
The Virtual Address Descriptor (VAD) tree is a data structure used by the Windows memory manager to keep track of the virtual address space of a process. It is a self-balancing binary tree (specifically, an AVL tree) where each node represents a range of virtual addresses.
#### Key Components of a VAD
1. **Starting and Ending Addresses**: Each node in the VAD tree specifies the starting and ending virtual addresses of a memory region.
2. **Memory Protection**: Information about the protection attributes (e.g., read, write, execute) of the memory region.
3. **Commit Charge**: The amount of physical memory committed to the virtual address range.
4. **Subsection Information**: Details about the mapping of the memory region, such as file-backed or private allocations.
5. **Flags and Attributes**: Various flags indicating the state and properties of the memory region
***
## Page Table Entries (PTE)
A Page Table Entry (PTE) is a data structure used in the virtual memory system of an operating system to store the mapping between virtual addresses and physical addresses. Each PTE corresponds to a single page of memory and contains information about the properties and state of that page. Common fields in a PTE include:
1. **Physical Page Frame Number (PFN)**: The physical address of the page frame in memory.
2. **Present Bit**: Indicates whether the page is currently in physical memory.
3. **Read/Write Bit**: Specifies if the page is writable.
4. **User/Supervisor Bit**: Determines whether the page can be accessed in user mode or only in supervisor (kernel) mode.
5. **Accessed Bit**: Set by the hardware when the page is accessed.
6. **Dirty Bit**: Set by the hardware when the page is written to.
7. **Page Size Bit**: Indicates the size of the page (e.g., 4KB, 2MB).
8. **Cache Disable Bit**: Indicates whether caching is disabled for this page.
9. **Protection Bits**: Define access permissions (read, write, execute).
***
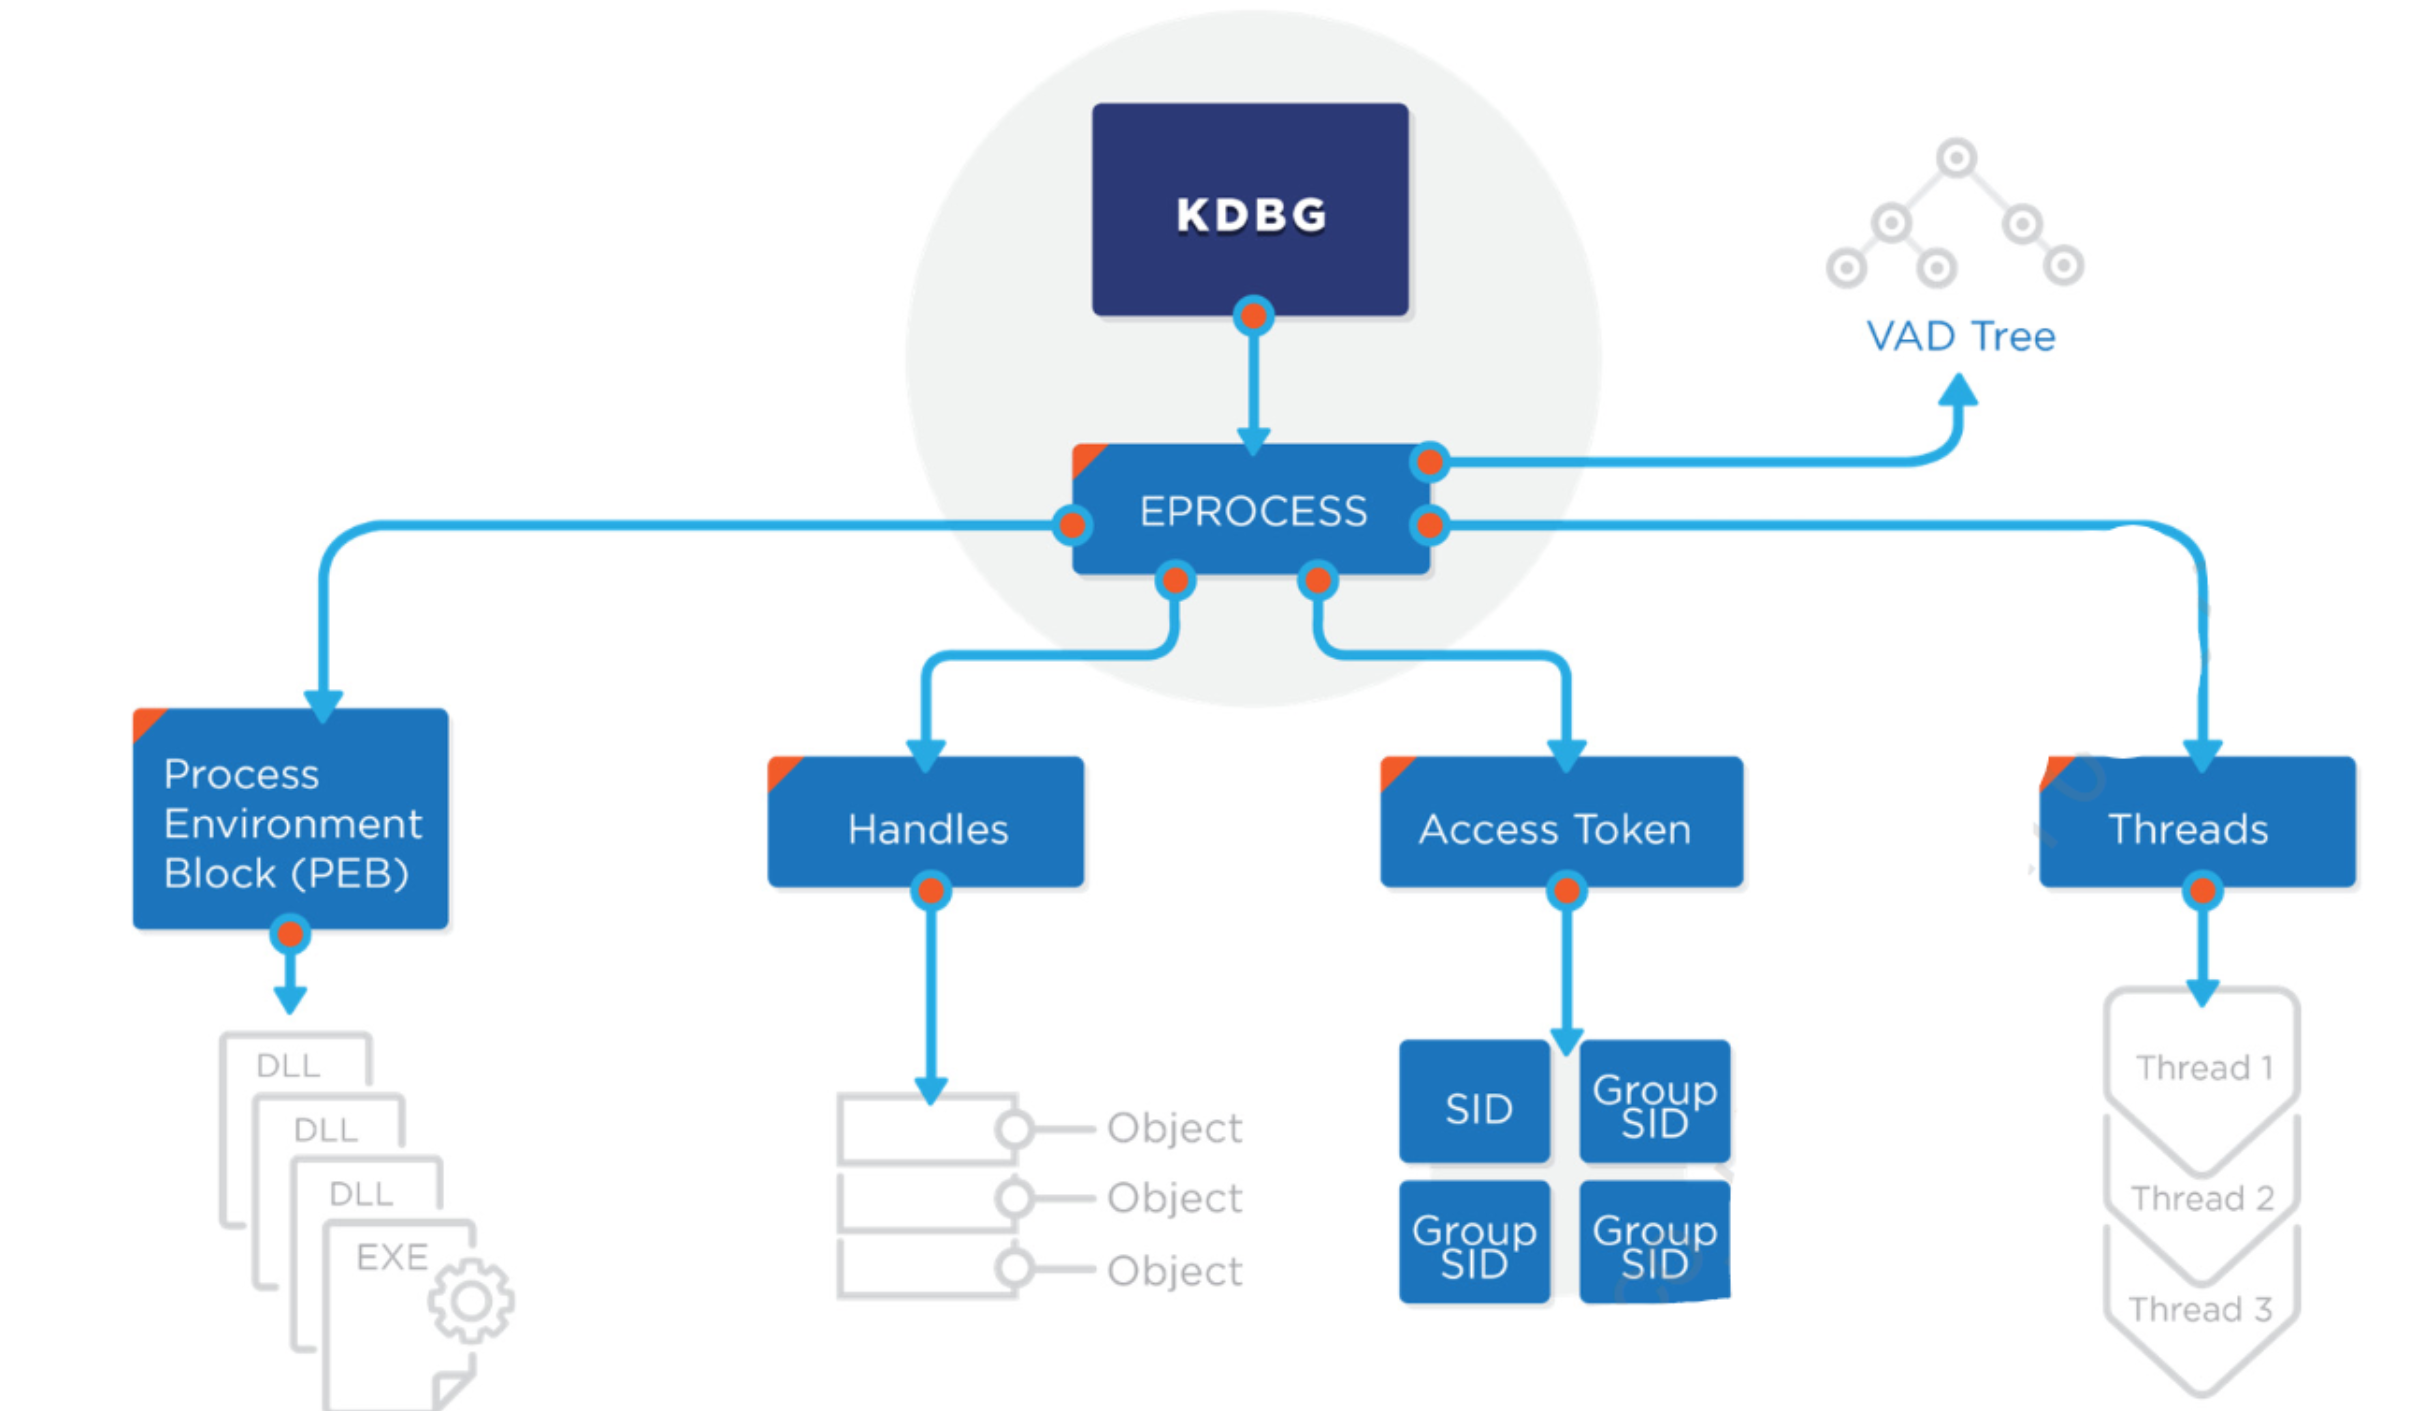
## Executive Process (EProcess)
includes the majority of metadata for a process, providing the following:
* Name of process executable
* Process Identifier
* Parent Process Identifier
* Location in memory (offset)
* Creation Time
* Termination time
* Threats assigned to the process
* [#handles](#handles "mention") to other operating system artifacts
* link to the [#virtual-address-descriptor-vad-tree](#virtual-address-descriptor-vad-tree "mention")
* Link to the [#process-environment-block-peb](#process-environment-block-peb "mention")
***
## Kernel Debugger Block (KDBG)
`KDBG` is a data structure whose pointers can be followed to find the process list for the system. This can be found via two methods:
1. find the Kernel Processor Control Region (`KPRC`) and follow the pointer to the `KDBG`. the `KPRC` in some Windows version has a fixed offset in the memory.
Once the `KDBG` is found, it leads to the `Execute Process` ( [#eprocess](#eprocess "mention") ) block list, by identifying the `PsActiveProcessHead` pointer (a list of all running processes in memory). Each process has it's own [#process-environment-block-peb](#process-environment-block-peb "mention") that holds:
* Full Path of executable
* `Cmdline` used to spawn the process
* linked list of all loaded `DLLs`
Each [#eprocess](#eprocess "mention") points to a [#virtual-address-descriptor-vad-tree](#virtual-address-descriptor-vad-tree "mention"), responsible for tracking every memory section (memory page) assigned to that process. This process allows for us to double check what exists in the memory sections for a process VS what the other lists are saying. **Discrepancies can indicate code injection**
**If a process is unhooked or hooked, it will not appear in any of the lists.** Therefore, we need to **scan** the memory to look for additional processes.
### Handles
Handles are a pointer to a resource, they exist in many forms. Some of the most important to memory analysis:
* **File Handles:** which items in the file system of which I/O devices are being access by the process
* **Directory handles:** Directory handles are known lists within the kernel that allow the process to find kernel objects. Common examples are knownDLLs, BaseNamedObjects, Callback, Device and Drivers.
* **Registry Handles:** Registry keys the process is reading or writing to
* **Mutex of semaphore handles:** Also called mutants, objects control or limit access to a resource. a mutex might be used by an object to enforce that only one process at a time can access it. Worms commonly set mutexes as a way of 'marking' a compromised system
* **Event handles:** Events are a way for process threads to communicate. Malware will occasionally use unique event handles
***
## Process Objects:
### Threads:
a process is a container for all the items that do the real work. Threads run within every process interacting with various system objects
### Memory sections:
A process is a collection of virtual memory pages where DLLs and files are loaded, and code and data are stored. the [#virtual-address-descriptor-vad-tree](#virtual-address-descriptor-vad-tree "mention"), maintains a list of these assigned memory sections
### Sockets:
Network connection endpoints - networks sockets are assigned to a specific process allowing us to trace back network activities
On a 32-bit system
VADS = Virtual App Descriptors = map to memory
Creates Virtual-Memory per process and has a shared Kernel
Memory Analysis process:
1. Identify Context
Find the kernel processor control region (KPCR), Kernel Debugger Data Block (KDBG) and/or the Directory Table Base (DTB)
2. Parse Memory Structures
Execute Process (**EPROCESS**) blocks \
Process Environment (**PEB**) blocks\
DLLs loaded \
Virtual Address Descriptors (**VAD**) Tree\
List of memory section belonging to the process\
Kernel modules/drivers
3. Scan for outliers
Unlinked processes, DLLs, sockets and threats \
Unmapped memory pages with execute privileges\
Hook Detection\
Known heuristics and signatures
4. Analysis: Search for anomalies
#### Private Memory
As described, private memory is the sole domain of the process and is not mapped outside of the process. Private memory is typically allocated with the API function VirtualAlloc and includes application data, the process heap, and the process stack. What you should not expect to find here are executables like EXE and DLL files. Most memory pages in private memory are instantiated with READWRITE privileges, which makes sense for items being read and written to in the stack, heap, and data files.
#### Shareable Memory
Also known as “mapped” memory, this part of process memory is designated for mapping all or part of shared files for use by the process. While data here can be shared with other processes, it is not required. Files like .dat or .mui files are regularly present here and mapped (loaded) from files on disk. Most permissions in this part of process memory are designated READONLY.
#### Image Mapped Memory
The “image” section of process memory is technically part of shareable memory but tagged differently. Files on disk are also mapped here, as it is intended for legitimately loaded executables (image binaries), DLLs, and drivers. This is the one area of process memory where execute permissions regularly occur, though the vast majority of image mappings use EXECUTE\_WRITECOPY (copy on write is a protective mechanism for shared code) and EXECUTE\_READ privileges instead of the commonly abused EXECUTE\_READWRITE.
Other items of note on the slide diagram are the Process Environment Block (PEB) is located in process memory (making it relatively easy for malware to manipulate), and kernel memory is also present. \[1] Kernel memory houses process items like memory pools (often taken advantage of by the Volatility “scanning” plugins) the VAD tree and page tables. We will use more of these structures shortly.